← Research from the project

Representations

What should a model be able to see in a molecule?

UniMolRep provides a common way to prepare molecular features and compare the information they carry.

UniMolRep: method and findings ↓Representation analysis ↓

Chemical identity is only part of the description

Two representations of the same molecule need not give a model the same information. A fingerprint records chemical patterns. A graph records connections between atoms. Angles and torsions describe how connected atoms are arranged in space. UniMolRep brings these descriptions together so their effects can be studied systematically.

Molecular representations. UniMolRep connects chemical patterns, molecular connectivity and three-dimensional geometry in a common representation framework. Figure 1, Guo et al. (2026).

Molecular representations

UniMolRep taxonomy linking a molecule to fingerprints, molecular graphs, bond angles and torsions.

UniMolRep connects chemical patterns, molecular connectivity and three-dimensional geometry in a common representation framework. Guo et al. (2026).

From coordinates to a grid

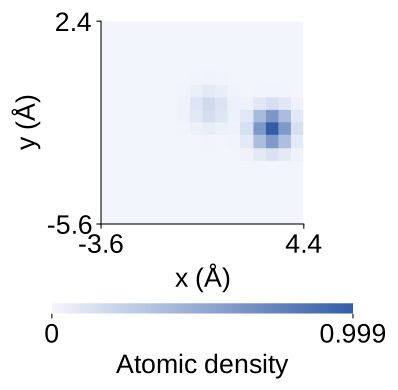
A molecular grid divides space into voxels. Separate channels record atomic features at each location, allowing a three-dimensional convolution to learn from local spatial neighbourhoods. The example below follows one aspirin conformer from its chemical structure to two element channels.

a Chemical structure
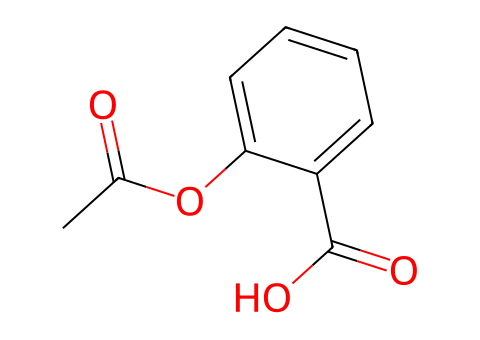
RDKit depiction of aspirin, CC(=O)Oc1ccccc1C(=O)O, with conventional oxygen colouring.

Aspirin’s bonds specify connectivity. A conformer places these same atoms in space.

b A plane through the conformer
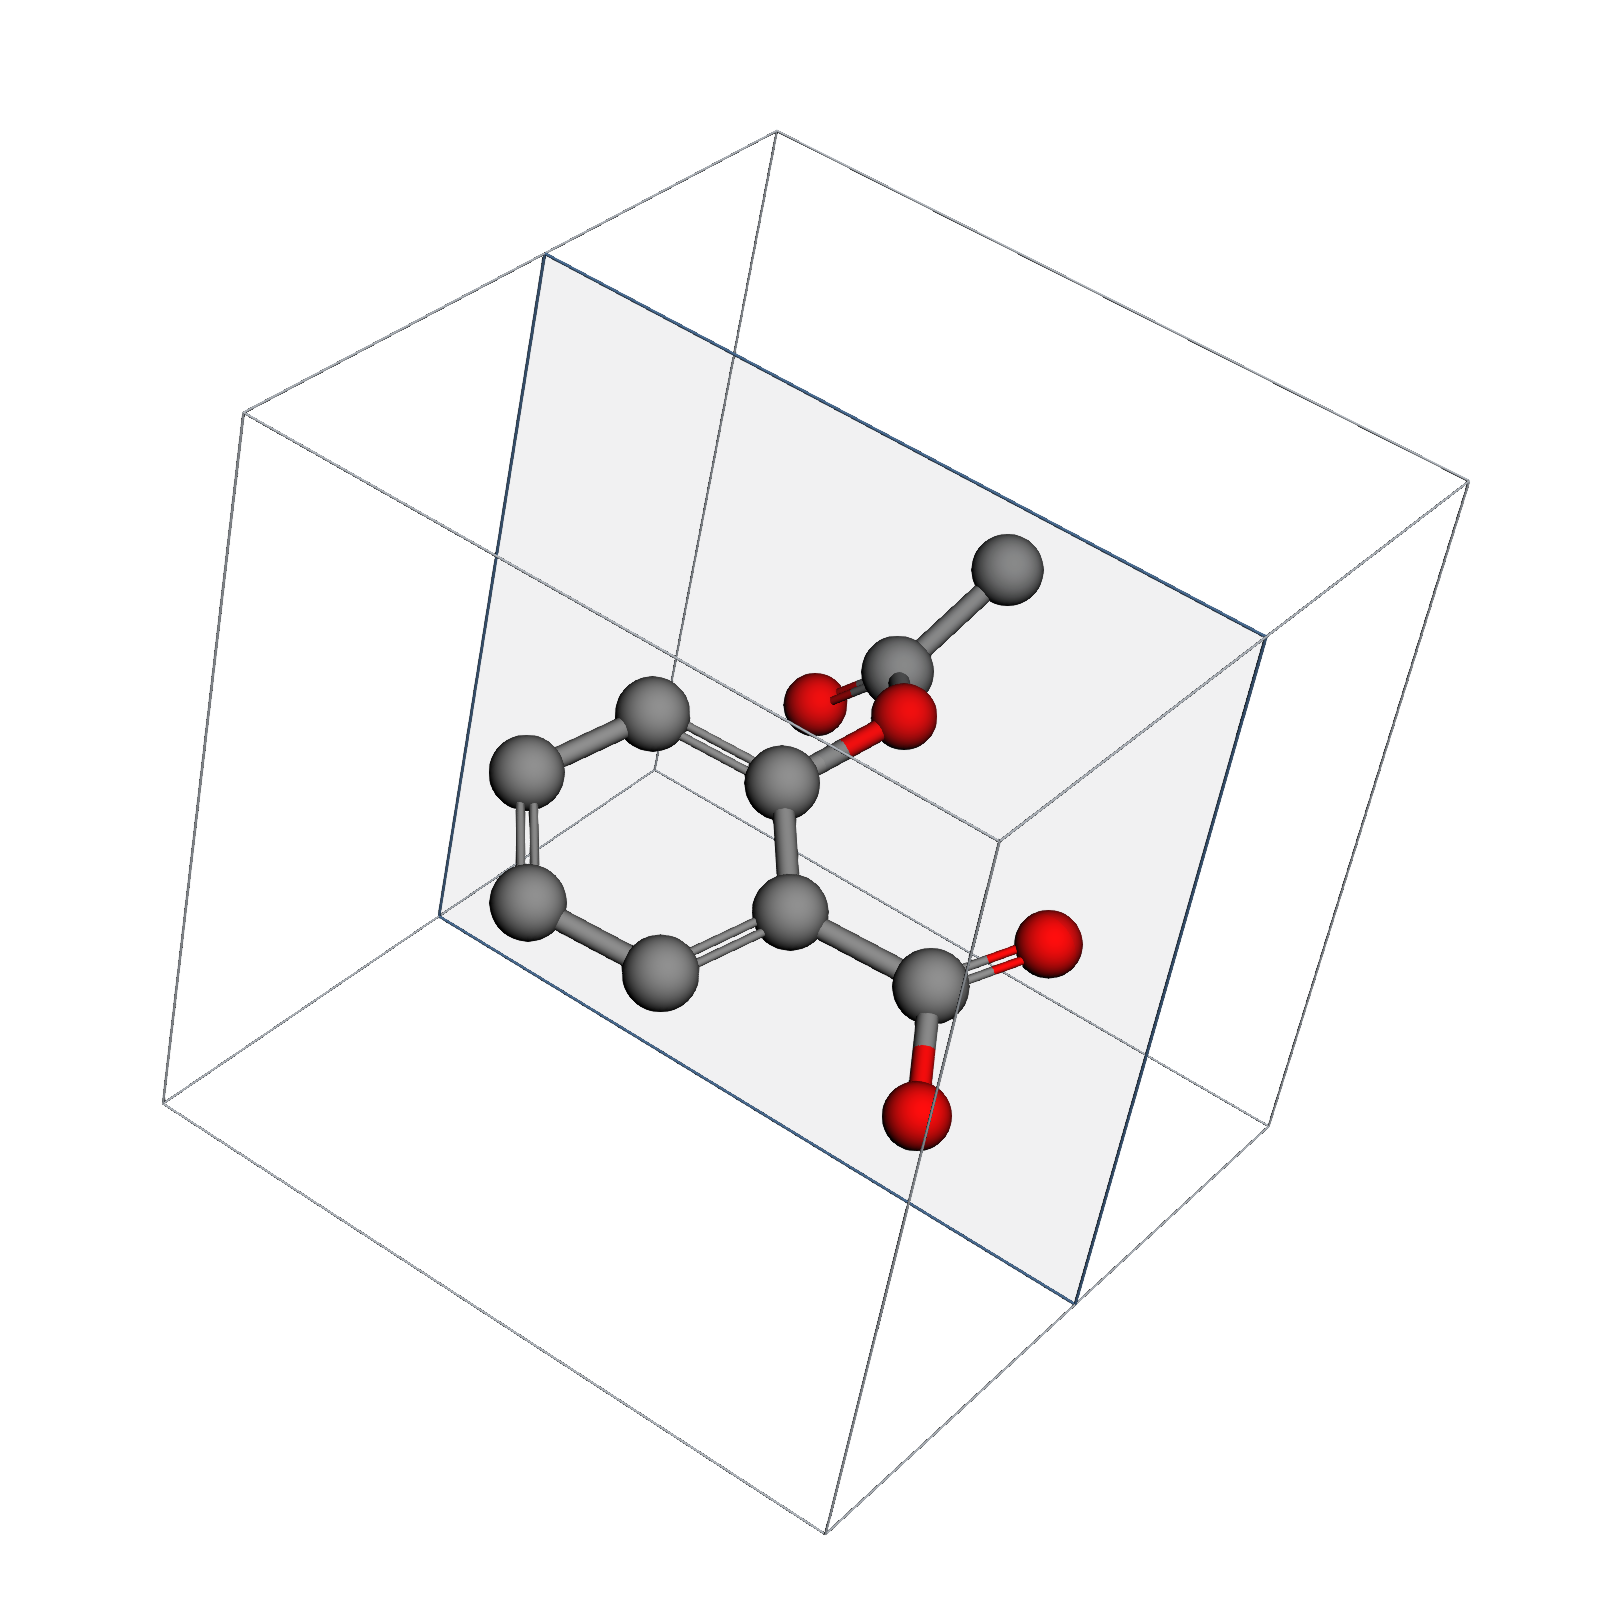
An aspirin conformer inside an eight-angstrom field, with its z = 3.02 angstrom cross-section marked in blue.

The blue plane is at z = 3.02 Å. Both element channels sample this plane.

c Element channels

Carbon
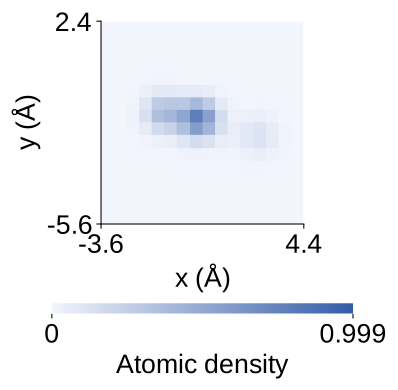
Carbon density on the indicated x-y plane, plotted at the original scale.
Oxygen
Oxygen density on the identical x-y plane and colour scale.

0.5 Å voxels; an 8 Å central field. Each channel retains a different part of the chemistry.

From chemical structure to spatial density. Each channel records the distribution of one element in the same aspirin conformer. Both plots show the indicated plane on a shared density scale. Illustration for UniMolRep; chemical structure drawn with RDKit.

UniMolRep: comparing representations

UniMolRep: A Python Package for AI-Oriented Molecular Representation Modeling ↗
Weiqing Guo, Jiawei Chen and Debby D. Wang
Journal of Chemical Information and Modeling (2026)

UniMolRep standardises preparation of fingerprints, graphs, geometric features, interaction features and grids. The toolkit covers small molecules, protein–ligand complexes and molecular trajectories. A shared preparation workflow makes it easier to compare representations for the same learning task.

Representation preparation. From molecular structures to fingerprints, graphs, interaction features and spatial grids. Figure 2, Guo et al. (2026).

Representation preparation

UniMolRep workflow converting molecular structures into representations for learning models.

From molecular structures to fingerprints, graphs, interaction features and spatial grids. Guo et al. (2026).

What the benchmarks show

On Tox21, combining fingerprints with topological graphs improved classification performance. For QM9 regression, the strongest evaluated configuration included angle and torsion features. The results illustrate why a representation should be chosen for the prediction task.

Molecular-property benchmarks. Representation comparisons on Tox21 and QM9. Higher AUC indicates better classification; lower MNMAE indicates smaller regression errors. Table 3, Guo et al. (2026).

Molecular-property benchmarks

UniMolRep Tox21 and QM9 benchmark table with representations, models, metrics, uncertainty and evaluation notes.

Representation comparisons on Tox21 and QM9. Higher AUC indicates better classification; lower MNMAE indicates smaller regression errors. Guo et al. (2026).

The protein–ligand affinity comparison

The PDBbind benchmark combines interaction fingerprints, graph features and geometric features. The combined 1D, 2D and 3D configuration achieved a Pearson correlation of 0.7359, RMSE of 1.3001 and MAE of 1.0132, leading the configurations evaluated in this study.

Representation comparisons for affinity prediction. On PDBbind, the combined 1D, 2D and 3D representation achieves the highest correlation and lowest errors among the evaluated configurations. Table 4, Guo et al. (2026).

Representation comparisons for affinity prediction

UniMolRep PDBbind comparison showing Pearson correlation, RMSE and MAE for individual and combined representations, with model definitions.

On PDBbind, the combined 1D, 2D and 3D representation achieves the highest correlation and lowest errors among the evaluated configurations. Guo et al. (2026).

Our AGIMA-Score study examines which protein–ligand contacts to encode when predicting affinity.

Representation analysis

Compare the representations of an example molecule or enter a SMILES sequence of your own. Select atoms and geometric features to see how the views correspond.

Preparing analysis…

References

  1. Weiqing Guo, Jiawei Chen and Debby D. Wang. UniMolRep: A Python Package for AI-Oriented Molecular Representation Modeling. Journal of Chemical Information and Modeling (2026).

← Research from the project